State Data
Confidence in data for this state:
HIGH
2018 data unless noted.
Definitions
Terms used on this website and in data sets are defined & discussed here.
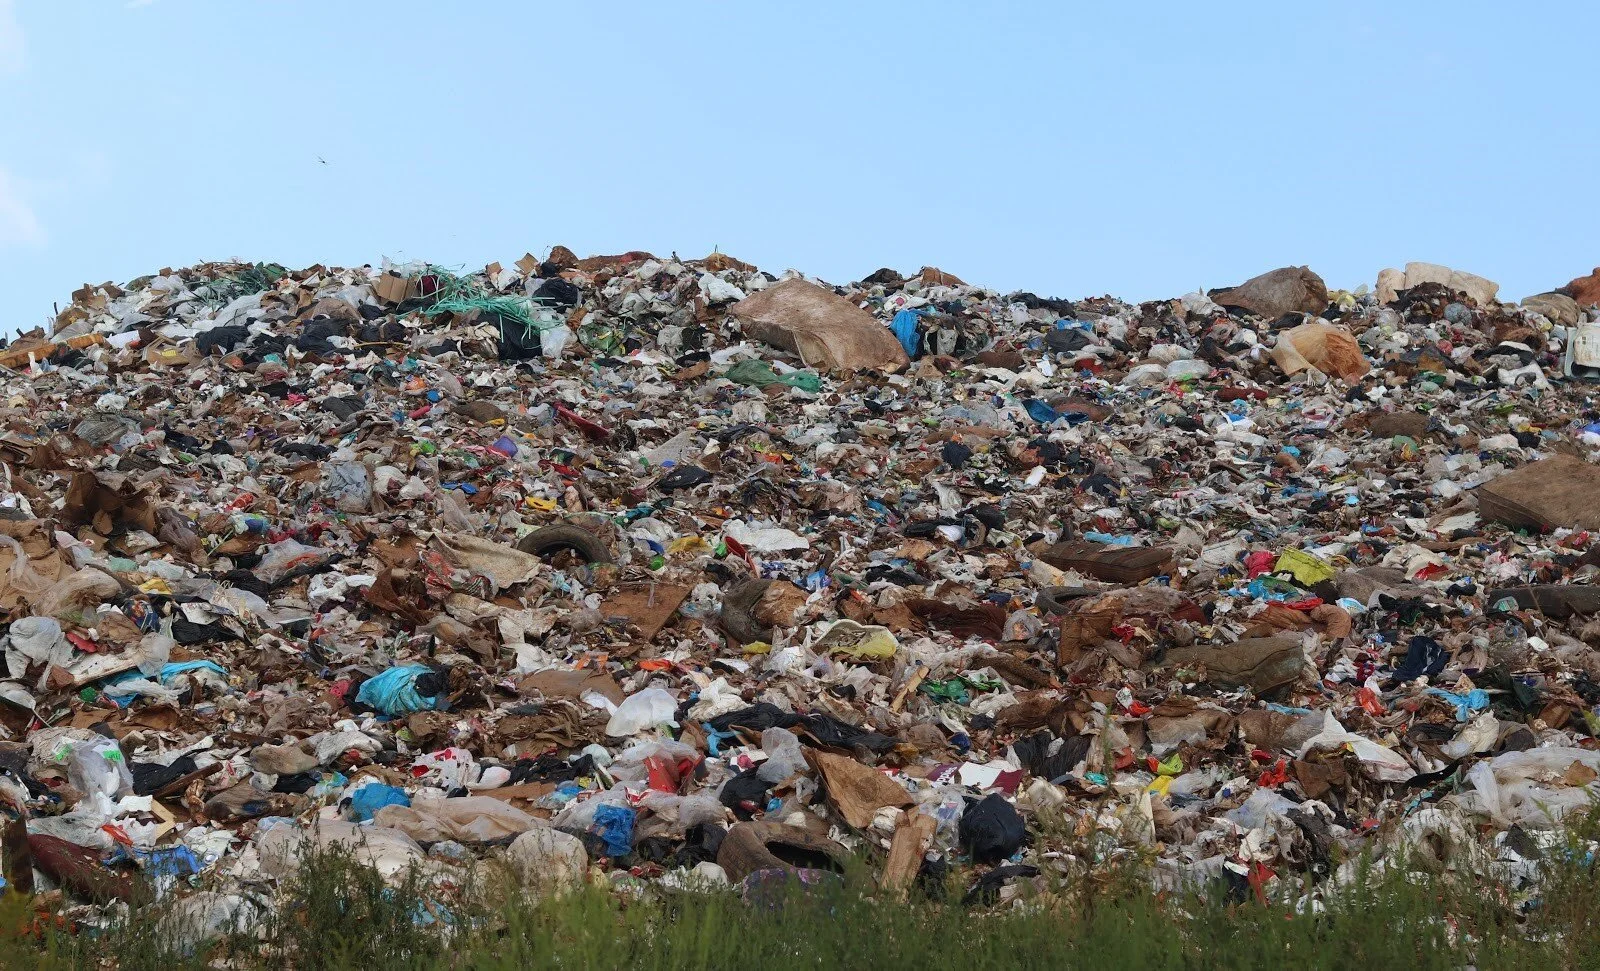
Landfill. Photo courtesy of Univ. of Georgia
State Statistics Dashboard
State Summary
● For the past decade or more, a large majority of Georgia biosolids have gone to landfill or incineration. Land application of Class B biosolids accounts for under ⅓ of the state’s wastewater solids production.
● ERTH Products - a long-standing, successful composting program - is one of just a few Class A biosolids programs.
● In 2018, challenges with landfill disposal and subsequent restrictions exposed the state’s reliance on this one outlet for most wastewater solids, and there has since been major disruption to biosolids management in Georgia, causing a shift to increased land application and creation of more Class A products, including at the Atlanta WRRFs.
● “Atlanta’s biosolids management story exemplifies how quickly the landscape and economics of biosolids management can change. Utilities that can be flexible and adapt their biosolids management plans will be well prepared to navigate what circumstance throws at them…” (Knight et al., 2020).


